Leading indicators
The OECD Consumer Barometer
The OECD has developed a new tool, the OECD Consumer Barometer that exploits and visualises consumer confidence data. The indicator, expressed as the monthly growth rate of the normalised consumer confidence indicator (CCI), has been designed with a view to clarity and reactivity in our presentation of measures of consumer sentiment. By showing the evolution over the past six months, the OECD Consumer Barometer synthesises and visualises developments in countries’ consumer confidence.
The map
The map provides a unique view of the OECD Consumer Barometer, following the evolution of the normalised consumer confidence over the past 6 months for all countries for which data are available. The colour of the bar ranges from shades of reds to greens representing negative (pessimistic outlook) and positive (optimistic outlook) consumer barometer growth rates, respectively. In order to preserve cross-country comparability over the 6-month timespan, the upper and lower boundaries, as well as the colour ranges therein, are calibrated at each new release to the highest monthly growth rate in absolute values for all available countries over the period.
Data
Calculation
The OECD Consumer Barometer corresponds to the monthly growth rate of the normalised consumer confidence indicator (CCI). Following the definition given by the EC Joint Harmonised EU Programme of Business and Consumer Surveys, the CCI is computed as the arithmetic average of the seasonally adjusted net balances (share of positive and negative replies) of the following four questions:
- Financial situation over the past 12 months;
- Expected financial situation for the next 12 months;
- Expected generic economic situation for the next 12 months; and
- Expected major purchases for the next 12 months.
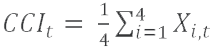
Each question has five possible answers: a lot better, a little better, the same, a little worse and a lot worse. The net balance is constructed with weights assigned on the extremes [“a lot better” and “a lot worse” with a weight of 1, “a little better” and “a little worse” with a weight of 0.5, and “the same” with a weight of 0] so for each country the CCI is calculated as follows for a time t:
 |
(1) |
Where Xi,t corresponds to the net balances of the four questions (i) above.
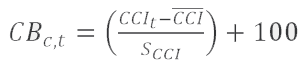
These data are then normalised by subtracting from CCIt its mean and dividing by its standard deviation. A value of 100 is added for rescaling purposes. For each country c, the OECD Consumer Barometer (CB) is therefore computed as follows:
 |
(2) |
| where |  |
corresponds to the mean of CCIt and the SCCI to its standard deviation: |
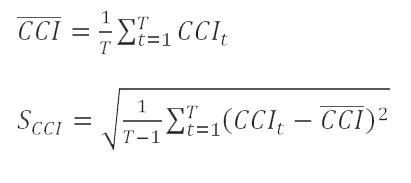 |
(3)
(4) |
Interpretation
In this form, an OECD Consumer Barometer reading greater than 100 signals a boost in consumer confidence towards the future, indicating an attitude to spend more on major purchases in the coming year, complemented by a modest propensity to save. Conversely, values below 100 indicate a pessimistic approach towards future developments in the economy, where saving is likely valued over consumption.
Seasonal adjustment
The underlying consumer confidence indicator is seasonally adjusted by either the European Commission (for EU countries) or by the countries themselves (for non-EU OECD and BRIICS).
Country data frequency
The frequency is usually monthly, but for a few exceptions, only quarterly figures are available: Colombia, Costa Rica, New Zealand, Switzerland, India, Russia and South Africa. For those countries, quarterly data are converted to monthly frequencies by means of interpolation.
Zone aggregates
The OECD computes zone aggregates for the following main country groupings, which are included in the dataset available on the OECD Data Explorer:
- OECD total: all OECD countries
- OECD Europe: all European countries that are members of the OECD
- G7, the major seven economies: United States, Canada, Japan, France, Italy, Germany and United Kingdom
- Major five Asian countries: China, India, Indonesia, Japan and Korea
- OECD plus major six non-member countries: OECD plus BRIICS
- OECD excluding Euro Area
More information on zone composition can be found at the methodology for compiling area totals. Zones are computed as annually chain-linked Laspeyres indices: for additional information please see the OECD Glossary.
Release dates
5 December 2023
10 January 2024
02 February 2024
05 March 2024
03 April 2024
03 May 2024
04 june 2024
02 July 2024
03 September 2024
02 October 2024
05 November 2024
03 December 2024
The map and the underlying data will be also updated around mid-month to account for late countries' updates.
Further reading
For further information, contact the OECD Statistics and Data Directorate at stat.contact@oecd.org
 |
 |
Related Documents